When I wrote Part 1, and Part 2 of “How to Productionize an AWS .Net Serverless Application”, I thought that would be it. I felt I had covered most of the generic activities that can be done, and that anything beyond that point would need to be application specific. Over the past few months, I’ve realised there are still few very specific yet improtant things I’d left out. As a result, I give you “Part 3”… who know’s, there may be a “Part 4” down the track.
.Net Memory Size in Lambda
Due to the way Lambda restrics the memory available to the runtime, the usual way the .Net attempts to calculate how much memory is available to it, results in the .Net runtime assuming a larger value than it actually has. This can have major impacts on how the .Net garbage collector functions. When the garbage collector is in server mode (the default when running in Lambda), it assumes it can use as much of the available memory as it wants. To save on CPU cycles, the .Net runtime doesn’t collect very aggressively, until it is just about out of memory. Unfortunately, if the runtime has less memory than it thinks, this can mean that it starts aggressive collection too late, and can easily run out of memory, and crash the runtime. The solution is to use environment variables to explicitly tell the runtime exactly how much memory it should expect.
For example, if you have a 2048MB Lambda, set the following environment variable: DOTNET_GCHeapHardLimit = 0x80000000. There is an
in depth explaination of this along with a table of common lambda sizes and appropriate values for this environment valriable
on the AWS .Net developers blog. A broader article about .Net garbage collection can be found here. For me setting this value is now part of productionizing any .Net Lambda.
Unit Test and Code Coverage Reports
Most developers know that unit tests are your first line of defence against bugs. When using the serverless.AspNetCoreWebApi or any of the other blueprints provided by the
dotnet lambda tools, a
test folder is automatically created for you with some sample unit tests. This is a great
starting point, but to ensure your project takes advantage of them, you need your team to be actively developing good quality tests with reasonable code coverage.
These tests should also be executed as part of the build phase of your CI/CD pipeline, and reported on. Different
CI/CD tools have different ways of achieving this, but here I’d like to look at how you can
achieve this using AWS CodePipeline.
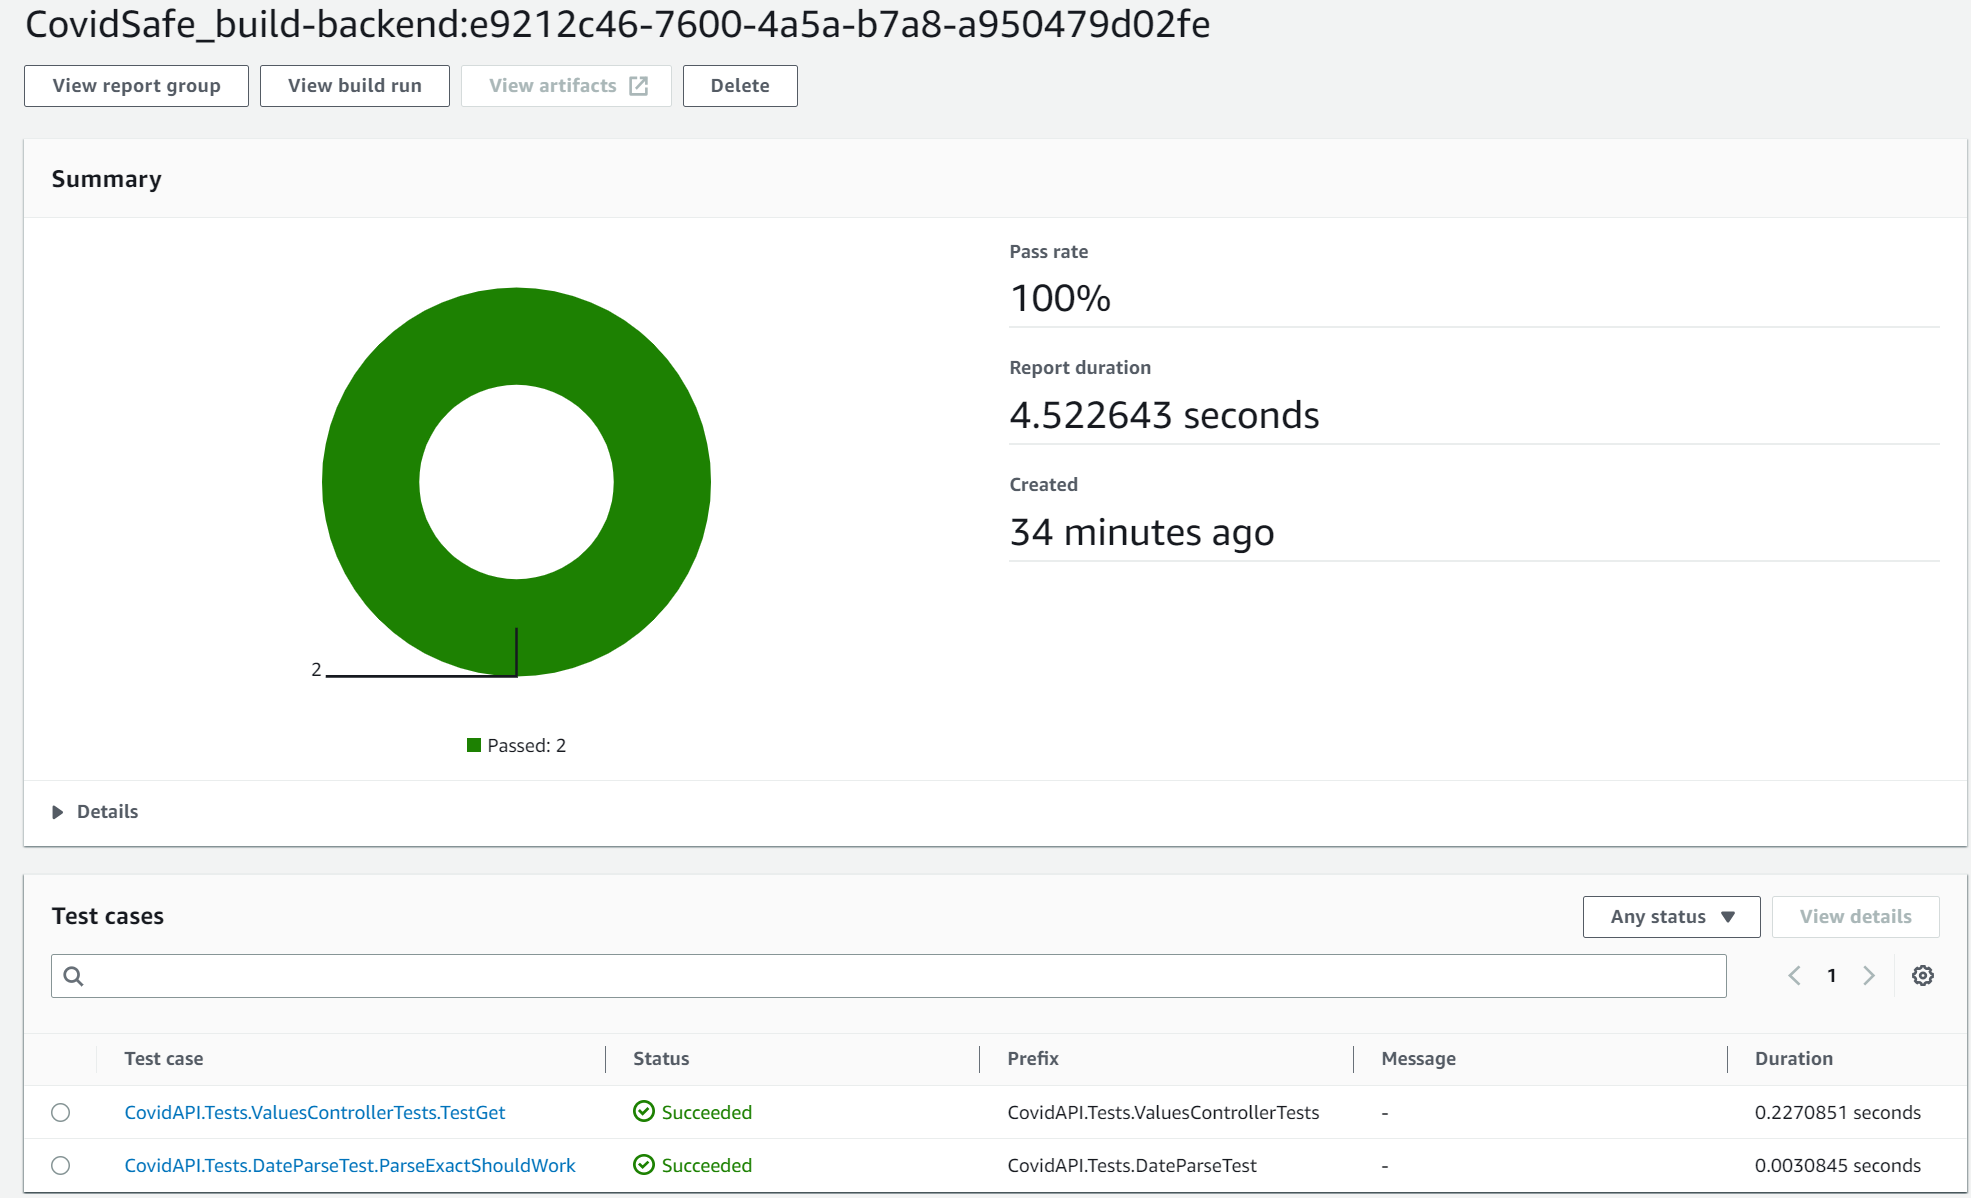
Unit Test Report
Firstly, running the unit tests is as simple as using dotnet test in your buildspec.yml, but to get it to produce basic reports, you need to specify a logger like this
- dotnet test ./test/MyAPI.Tests/MyApi.Tests.csproj --verbosity normal --logger "trx;LogFileName=MyAPI.trx" --results-directory './testresults'
Then you can add the trx file to the reports section of the buildspec.yml file like so:
  reports:
    backend:
      file-format: VisualStudioTrx
      files:
        - '**/*.trx'
      base-directory: './testresults'
This report will give you insights into test case pass rate, and duration over time, and even break these down by individual test cases.

CodeBuild will even give you a history snapshot showing how success/failure rates and test duration vary over time.
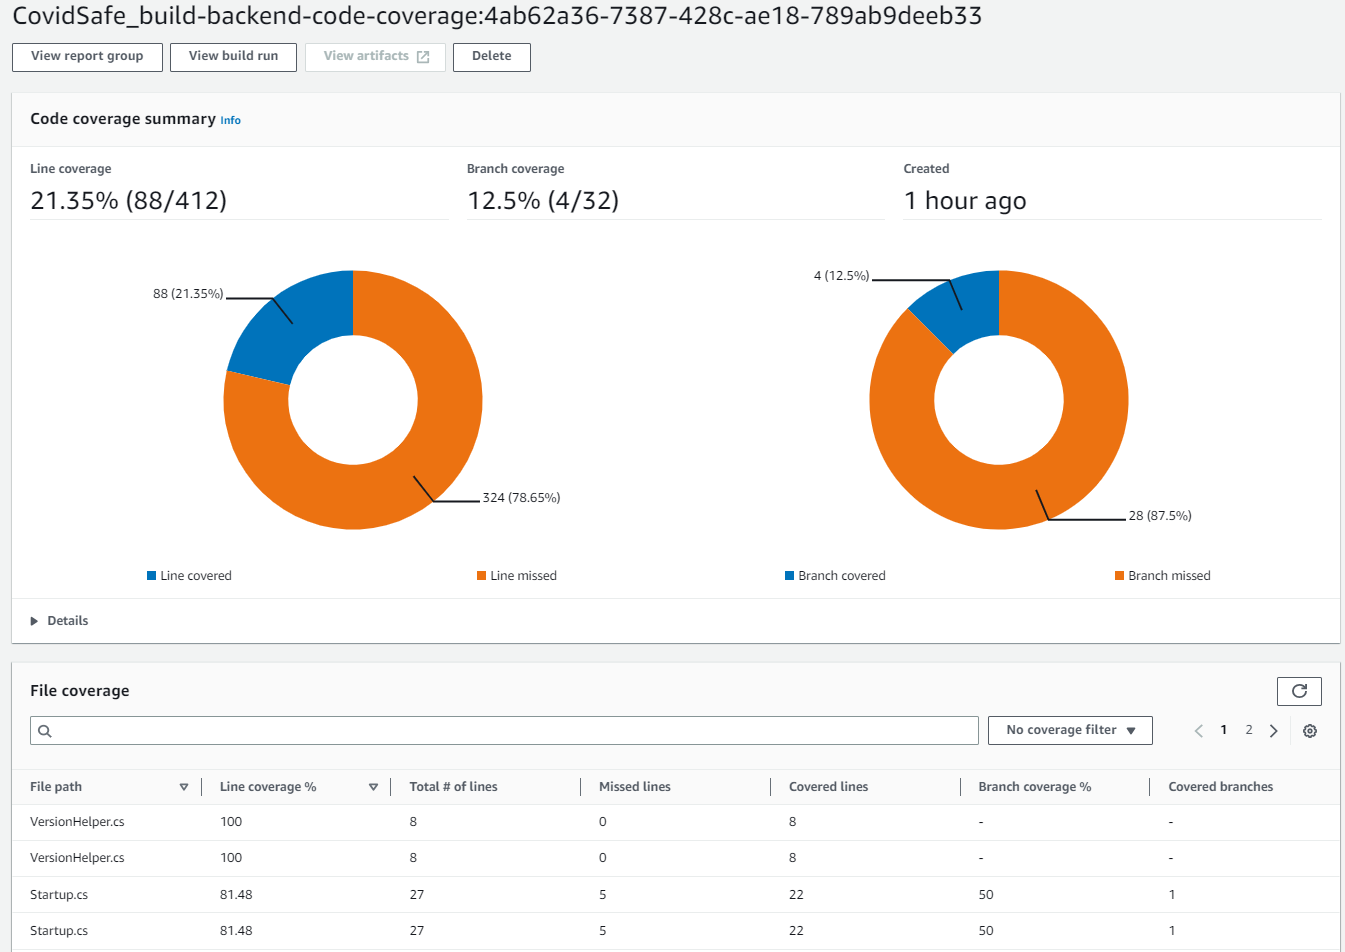
CodeCoverage Report
To enable Code Coverage, you need to use a format that CodeBuild supports. While you can coax your tools to spit out a number of different formats, I’ve gone with Cobertura XML. Configuring your .Net project is fairly straight forward.
Firstly, add coverlet.msbuild and coverlet.collector libraries to your test projects .csproj file.
 <ItemGroup>
    <PackageReference Include="coverlet.msbuild" Version="3.1.0">
      <IncludeAssets>runtime; build; native; contentfiles; analyzers; buildtransitive</IncludeAssets>
      <PrivateAssets>all</PrivateAssets>
    </PackageReference>
    <PackageReference Include="coverlet.collector" Version="3.1.0" />
    ...
Secondly, ensure you tell the dotnet cli to collect code coverage in that format by
appending --collect:"XPlat Code Coverage" to the dotnet test command in your buildspec.yml file. E.g.
- dotnet test ./test/MyAPI.Tests/MyApi.Tests.csproj --verbosity normal --logger "trx;LogFileName=MyAPI.trx" --results-directory './testresults' --collect:"XPlat Code Coverage"
Once this is done, you can add another report to the reports section of your buildspec.yml file like so:
reports:
...
  backend-code-coverage:
    file-format: COBERTURAXML
    files:
      - '**/*.cobertura.xml'
    base-directory: './testresults'
For a fully working example, see my open source project.

API Logging
I did talk a bit about logging in Part 1, but that was mainly around Lambda logging, and specifically around setting the log groups retention period. Obviously you want to have some kind of logging strategy to ensure that critical details are logged when it comes time to root cause an incident, but this gets very application specific.
One form of logging that can play easily into your logging strategy are API logs. There are 2 types of API logs, Access Logs and Execution Logs. These are produced by AWS API gateway and can have some very useful information.
The first step in setting up API Gateway logging is to grant API Gateway the appropriate permissions. In order to do this you need to create a role as shown in the following cloudformation:
  ApiGatewayCloudWatchRole:
    Type: 'AWS::IAM::Role'
    Properties:
      AssumeRolePolicyDocument:
        Version: 2012-10-17
        Statement:
          - Effect: Allow
            Principal:
              Service:
                - apigateway.amazonaws.com
            Action: 'sts:AssumeRole'
      Path: /
      ManagedPolicyArns:
        - >-
          arn:aws:iam::aws:policy/service-role/AmazonAPIGatewayPushToCloudWatchLogs
Once this role has been created, you need to assign the role to API Gateway. This needs to be done at an account/region level (not an API level), so it should form part of your landing zone for accounts you wish to host APIs in. This is achieved using the following cloudformation:
  APIGatewayCloudWatchAccount:
    Type: 'AWS::ApiGateway::Account'
    Properties:
      CloudWatchRoleArn: !GetAtt ApiGatewayCloudWatchRole.Arn
Note, see here for details on setting this up in the AWS console. Similar to the Lambda logs, I suggest creating the log groups explicitly so that you can set the log retention period.
  ApiGatewayAccessLogGroup:
    Type: AWS::Logs::LogGroup
    DeletionPolicy: Delete
    UpdateReplacePolicy: Delete
    Properties:
      LogGroupName: !Sub "/aws/apigateway/${StackLabel}GatewayApiAccessLogs"
      RetentionInDays: !Ref LogRetentionPeriod

  ApiGatewayExecutionLogGroup:
    Type: AWS::Logs::LogGroup
    DeletionPolicy: Delete
    UpdateReplacePolicy: Delete
    Properties:
      LogGroupName: !Sub "API-Gateway-Execution-Logs_${GatewayApi}/Prod"
      RetentionInDays: !Ref LogRetentionPeriod
There are a number of options for what can be placed in the Access Logs, and this should be configured as part of the API Gateway deployment.
For example:
      AccessLogSetting:
        DestinationArn: !GetAtt ApiGatewayAccessLogGroup.Arn
        Format: '$context.requestId $context.accountId $context.identity.userArn $context.identity.sourceIp method: $context.httpMethod $context.requestTime'
Full details on what can be sent to access logs can be found here.
Conclusion
Nothing earth shattering, just some more good practices to adopt/follow when creating .Net Lambda based APIs.
